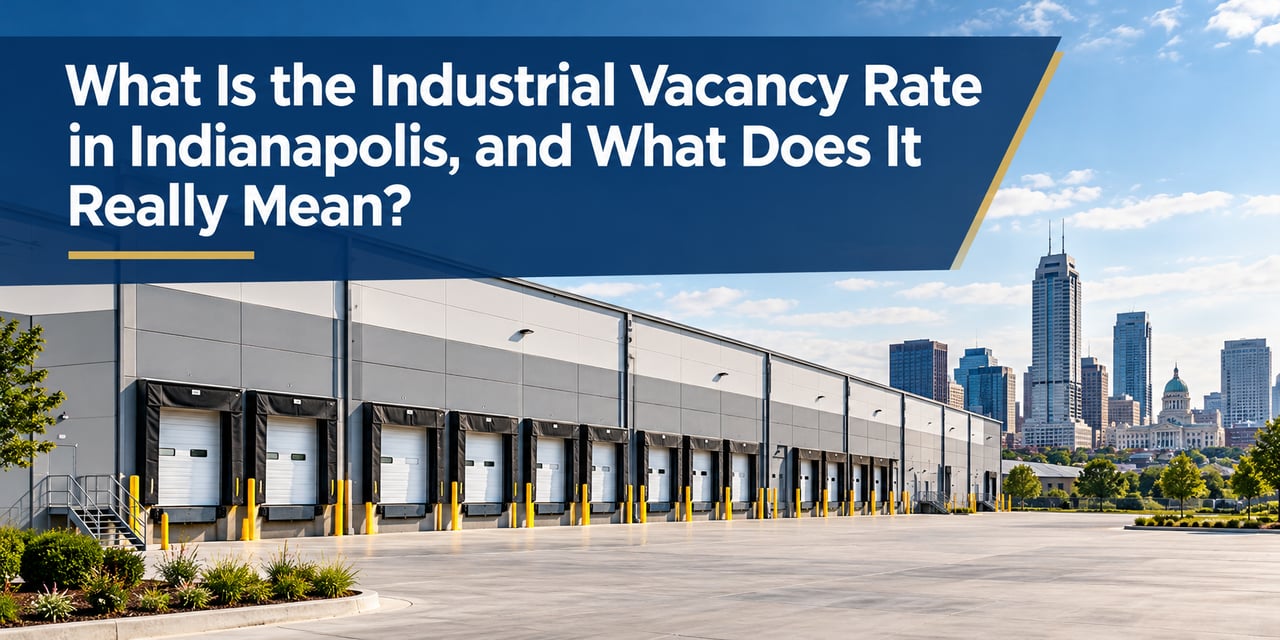
Every quarter, brokerage firms publish an Indianapolis industrial market report with a headline vacancy rate. Business owners read that number and conclude, "Vacancy is up, so rents must be falling" or, "Vacancy is low, so I'll never find space." Both conclusions can be wrong. Here's how to interpret the Indianapolis industrial vacancy rate so it actually helps your decisions.
What the Indianapolis industrial vacancy rate measures
Vacancy is the share of total industrial square footage that is physically empty. Availability is broader: it includes vacant space plus space that's occupied but listed for lease or sublease. Net absorption measures the change in occupied space over a period. Together, these three numbers tell a far better story than vacancy alone.
Why big buildings distort the Indianapolis vacancy rate
The Indianapolis industrial market includes many enormous distribution buildings. When a new 1- million-square-foot speculative warehouse delivers empty in Whitestown or Plainfield, the metro vacancy rate jumps — even though that building has nothing to do with a contractor looking for 5,000 square feet in Carmel.
Vacancy by size: where most local businesses compete
In many periods, vacancy in buildings over 500,000 square feet runs much higher than vacancy in buildings under 50,000 square feet. Most local manufacturers, contractors and distributors compete in the smaller segment, where little new supply is built. That's why many Central Indiana businesses struggle to find space even when the headline vacancy rate looks high.
Vacancy by submarket
Vacancy on the northeast side near Mt. Comfort can look very different from the northwest side near Whitestown, the south side near Greenwood and Franklin, or the airport area near Plainfield. Hamilton County has very little true industrial inventory, so a few vacancies in Carmel or Fishers can swing local availability dramatically.
Vacancy by building class
Functionally obsolete buildings may sit empty for years, inflating vacancy for a submarket even while modern buildings and well-maintained Class B buildings lease quickly.
Speculative construction and timing
When developers deliver a wave of speculative buildings at once, vacancy rises temporarily even if leasing demand is strong. Watch net absorption over several quarters to see whether tenants are filling space.
Sublease space
When companies right-size, they list unused space for sublease. Rising sublease availability can signal a cooling market — and create bargains for tenants who want shorter terms.
How tenants should use the Indianapolis industrial vacancy rate
Ask for data filtered by your size range, building type and submarket. If vacancy in your segment is high, push harder for free rent, improvement allowances and flexible terms. If it's tight, start earlier and be ready to act quickly.
How owners and investors should use it
Owners should price renewals and new leases based on their specific segment. Investors should look for submarkets with limited new supply and consistent positive absorption.
An example: two businesses, one Indianapolis industrial vacancy rate
Imagine the quarterly report shows the Indianapolis industrial vacancy rate rising. A national 3PL looking for 400,000 square feet sees several large, empty speculative buildings competing for its business. It negotiates aggressive free rent and a generous improvement package.
At the same time, a Fishers electrical contractor looking for 6,000 square feet finds almost nothing available within 15 minutes of its customers. The few spaces that come up lease within weeks. For the contractor, the market feels anything but soft.
Both experiences are real, and both happen in the same quarter. That's why I always filter market data before advising a client: the headline number describes the whole market, while your negotiation depends on your slice of it.
Leading indicators to watch beyond the Indianapolis industrial vacancy rate
• Construction starts: fewer starts today means less new supply in 12 to 24 months.
• Net absorption trends: several quarters of positive absorption signal real demand.
• Sublease listings: rising sublease space can foreshadow softer conditions.
• Lease renewal rates: tenants renewing in place suggest limited alternatives.
• Concessions: growing free-rent packages are an early sign of landlord competition.
Tracking these together gives a much clearer view of where the Central Indiana industrial market is heading than any single vacancy number.
Frequently asked questions
What is the difference between vacancy and availability? Vacancy is empty space; availability includes empty space plus occupied space being marketed.
Why is it hard to find small warehouse space when vacancy is high? High vacancy is often concentrated in large buildings, while small-bay space stays tight.
Where can I get Indianapolis industrial market data? Brokerage market reports offer metro numbers; a broker can provide data filtered for your needs.
Get a custom Indianapolis industrial market snapshot
I prepare tailored Indianapolis and Hamilton County industrial market reports filtered by your size range, building type and submarket — so you negotiate with real data.
Annie Scott — Annie Scott Realty Group LLC / F.C. Tucker Company Cell: (317) 902-8622 ·